Last week together with my team consisting of University of Warsaw and Warsaw University of Technology students:
- Krzysztof Wodnicki
- Piotr Trzaskowski
- Filip Szympliński
we went to Cracow to AGH University of Krakow to take part in EnsembleAI hackaton.
This hackaton was like no other. It wasn’t organised by the companies, but by the scientific clubs from various Polish’s universities and academic institutions partnering with SprintML lab of CISPA and sponsors mBank and Jetbrains. The tasks weren’t focused on creating the a user application but rather on creating (and inventing) better solutions to ML security problems and the solution evaluation was very numerical.
I especially liked the scientific vibe. The organizers provided us with scientific papers related to each task and reading those was essiential to understanding the problems as well as a starting point for creating solutions.
We were also given access to Academic Computer Centre Cyfronet AGH to Athena supercomputer which was a very fun and challenging experience. We were given one node (or maybe fraction of the node) per team and connecting and working through SSH on the GPU cluster was not so easy - required reading the provided documentation but also some knowledge on how to setup a Python environment.
 .
.
Also we were limited to one cluster session per our account. So if one team member
closed the his VSCode window (while using remote ssh extension) without proper disconnecting, his session wouldn’t end immidiately and we were blocked.
Fortunately we found a solution in killing this processes using kill -9.
Among the authors of the task there were present the authors of the Bucks for Buckets method. It’s a defence technique against stealing encoders exposed via public API. Our task was to steal such an encoder. From the results of the competition we can say, that the method works very well - it a was very challenging task and there were no revolutionary solutions.
Since I focused on the first task, I will not dive deeply into the others.
First task - Membership Inference Attack
In the first task we had to correctly diagnose whether the sample was part of the training dataset for the model. It’s called Membership Inference Attack in the literature.
We were given:
- the model with all it’s parameters
- validation dataset with data samples and membership class
- the dataset that for each sample (data point) we had to tell whether it was part of the training process (target dataset).
As a preparation, I have read one paper “Membership Inference Attacks From First Principles” that compared different methods and tried to asses how much improvement they give. It was very well written and was a nice introduction to the topic as it focued on the fundations.
Not always more input information means better model
All of our solutions compared the losses of each sample. Altough you can compare different things:
- you can compare the logit outputs before softmax (for data points outside of the training data logits should be bigger)
- you can compare the probability distribution (for data points outside of the training data model should be less certain)
- you can compare the gradient values in all layers (for data points outside of the training data gradients should be bigger, as it is not in the minimum)
- you can compare the loss function value (for data points outside of the training data loss should be bigger) we though we try the simplest approach at the beginning - in loss you have just one number.
But in my view the loss is also a very powerful indicator, because it combines all the other numbers (gradients, logits, softmax) in a single number in good ratios - the model training backpropagation is in the end calculating gradients from the loss function. So we didn’t have to learn the model that would do the same thing - calculate which parameters have the highest levarage to the task.
The solution from the technical details
First we created the baseline solution - to check that if the system will work and to create better solutions on top of that. The baseline solution was to calculate all the losses of the validation data set we were given and simply create a threshold for all samples. If the loss from the data point is above the threshold, then that sample was not part of the training process. (Disclaimer: in this task we had to output the probability on a scale from 0 to 1, but that’s just one step before classification. I will use the threshold analogy because I think it is more intuitive).
After fierce discussion, we decided to don’t implement this basic solution, but aimed for something bigger from the start. One threshold for all data points may not be the best idea because some samples are easier to train and some harder. Perhaps the thresholds should be separate for each class? The model we were given classified the image into one of the 44 classes. With 13,000 test samples, there should be enough samples for each of the 44 classes to learn distributions for each class. This “baseline” solution was one of the best for about 10 hours.
The second approach is to create a threshold per sample. But since we only have one target model, we get a loss for each image - and we don’t know the true class (1 - in training, 0 - out of training). The solution was to use shadow models. These models have the same architecture as the original and the training process should be similar. We trained the 250 models on the classification dataset (the dataset we were supposed to classify) and the dataset we know the target model was trained on. But each model was trained on a random half of the classification dataset, so for each data point we had about 125 models where that data point was part of the training process. As a result, for each sample we had about 125 “in training data” losses and 125 “out of training data” losses.
To classify each sample we used statistics. The method is called LIRA - Likelihood ration attack. For each sample we approximate the “in” and “out” distributions of losses with gaussians. Then, when we have our “true model” loss we have to classify whether is belongs to the “in” distribution or “out” distribution. We can do that with Likelyhood ratio. After that we can model the output as 0 to 1 continuous probability and that is our result.
Lost hopes near the end
Our score on the leaderboard was almost always the best. But other teams were very close to us, the difference was on the fourth decimal place. About 4 hours before the end we lost the 1st place in this task. As there was no time to try out different techniques, the mentor advised us to just train more shadow models. We tried that, but still couldn’t regain first place.
But the score was calculated only on the 30% of test dataset. After calculating final results we saw that not only our solution to the first task was on the 1st place, but there was a larg gap between us and the 2nd place. The team that lost the 1st place must have had an emiotional rollercoaster.
Final thoughs
One thing I regret is that we didn’t try to go for the Bucks for Buckets task and try something innovative. The hackaton was also about trying out solutions that were not part of the known research and mabye could be (and may be our start in the scientific journey).
This was my first hackaton and I didn’t know what to expect, but I really enjoyed it. It wasn’t without its technical difficulties (how do you order 100 pizzas to arrive on time?), but despite that the organisers did a very good job and I would like to thank them very much!
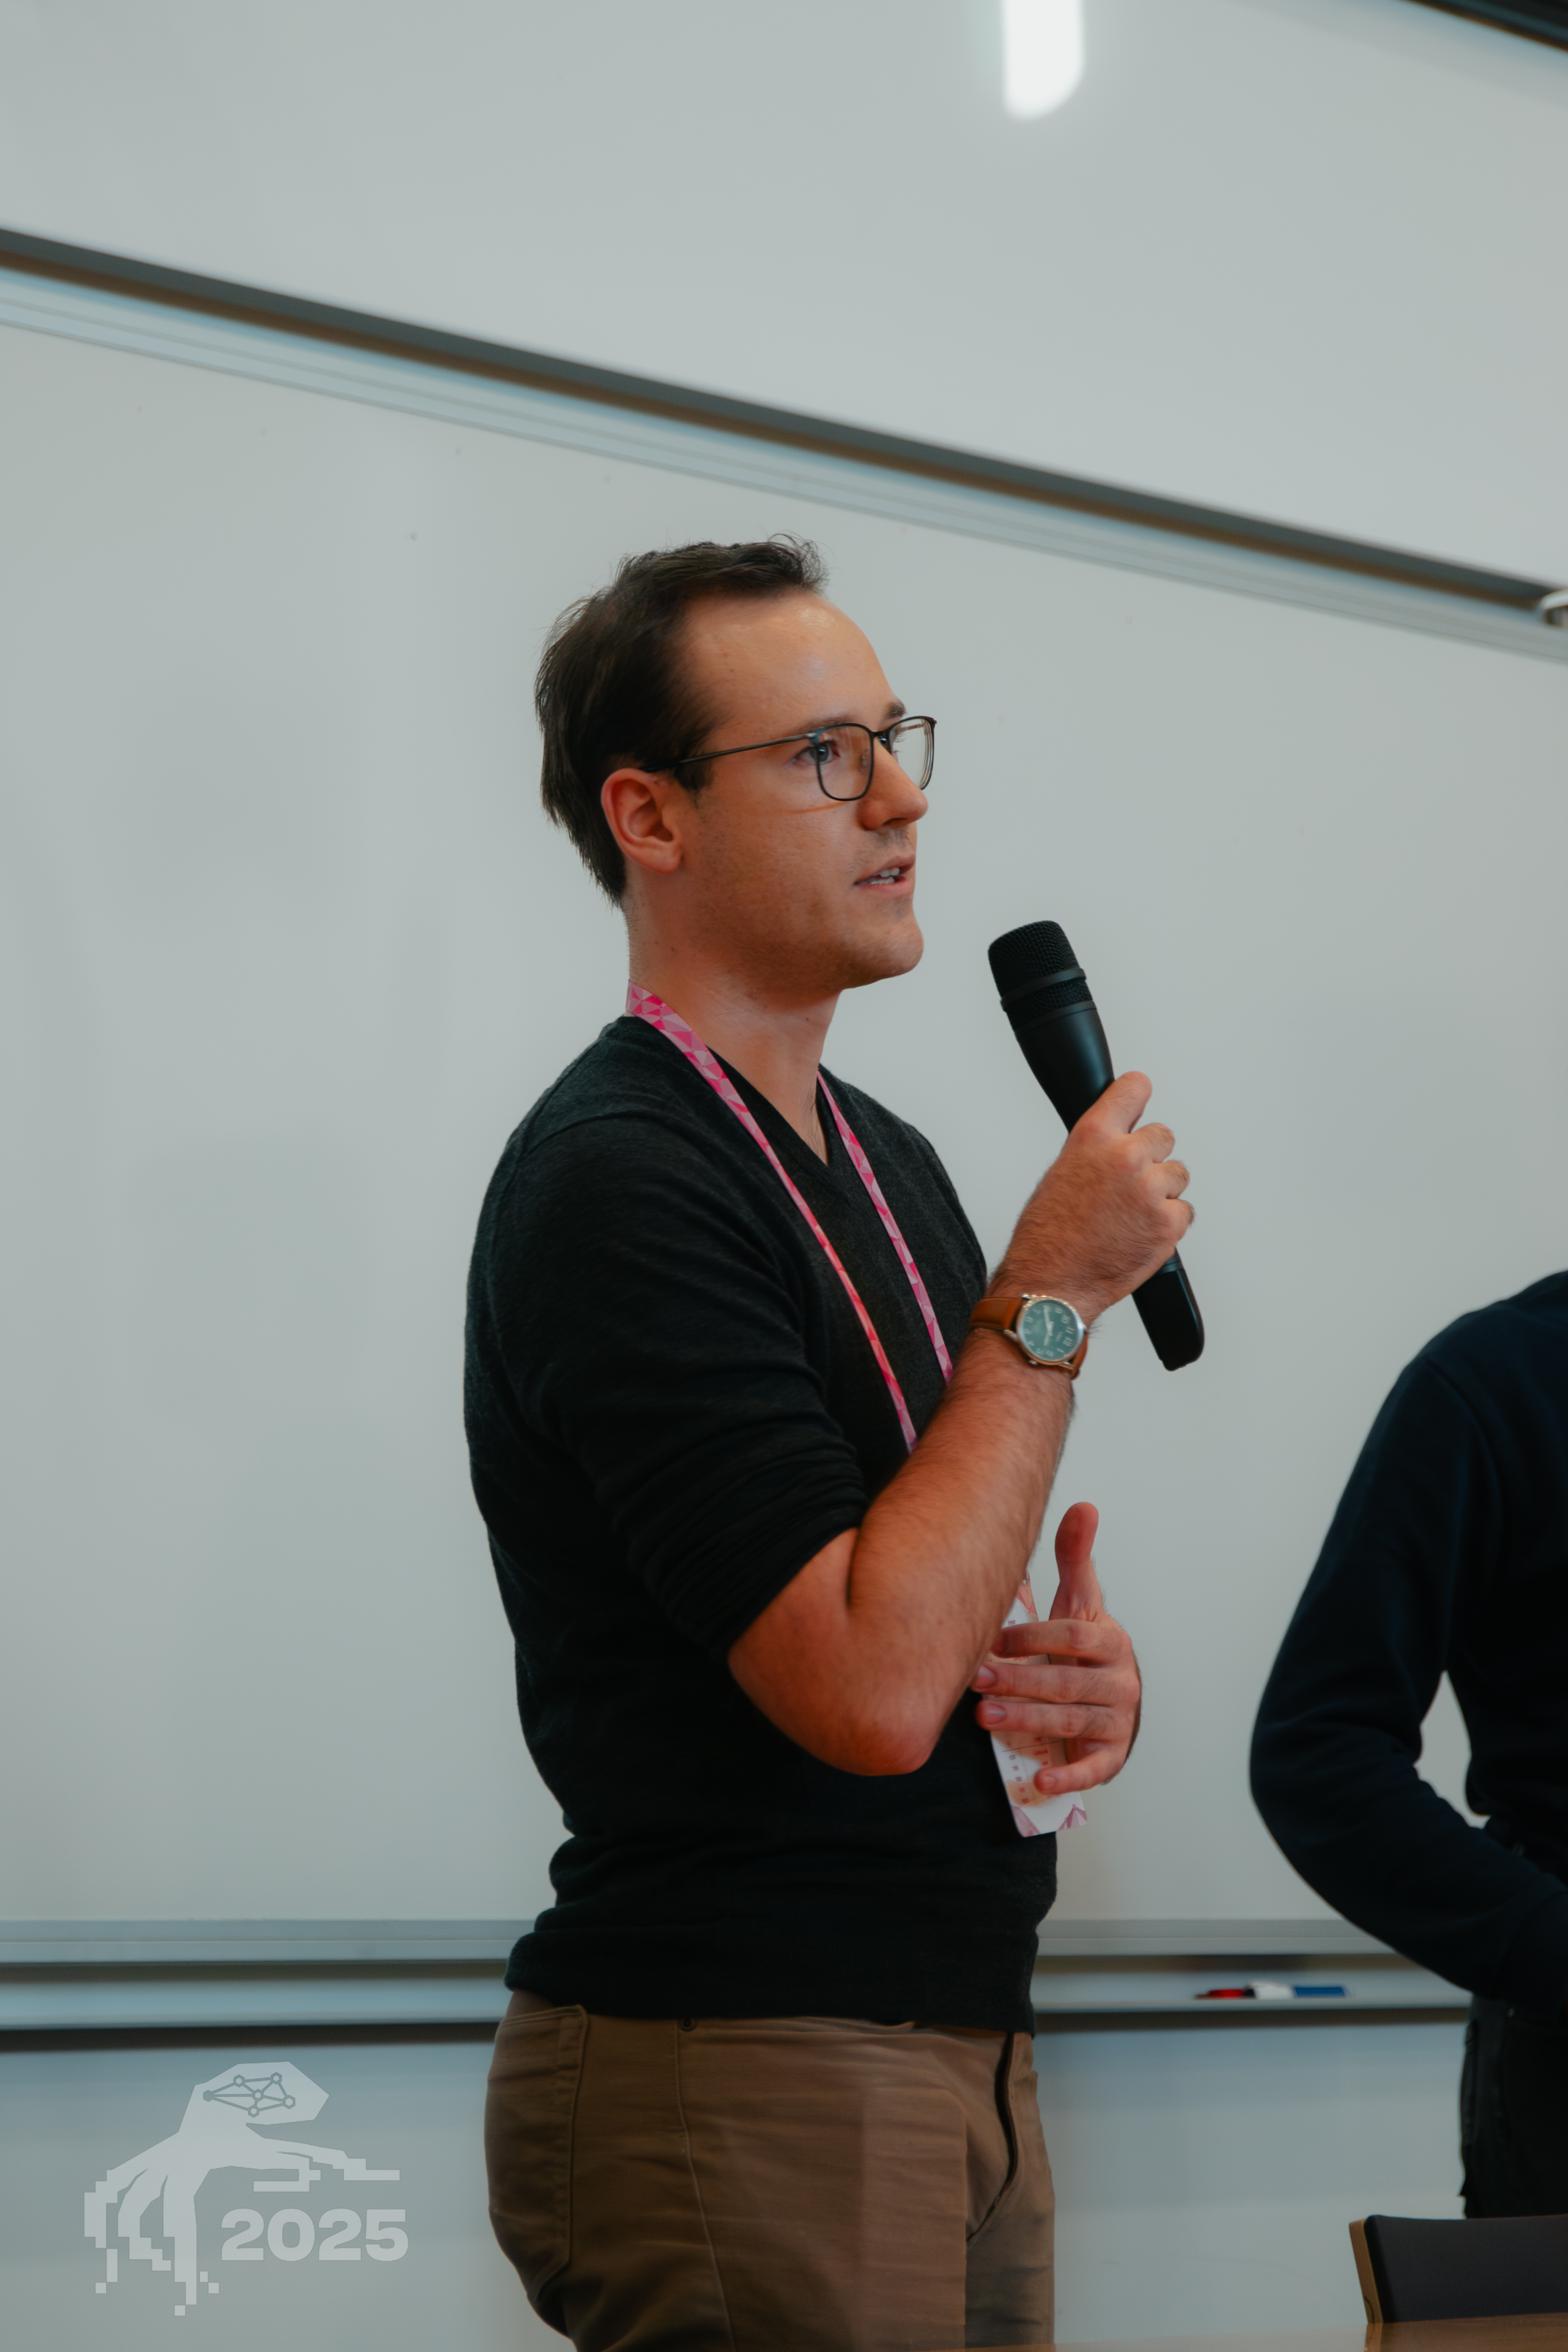
Here’s my picture from the my presentation of the first task: